Jan 30, 2018

Post 46: Sample trading plan $TUGS (last update Feb. 23,2018)

Today, I am posting one of my trading plan. I was so focused on my trading and other stuff that I wasn't able to post something new here. So here it is, at least just to keep the blog updated.

This sample trade will also show how simple I do my trading.

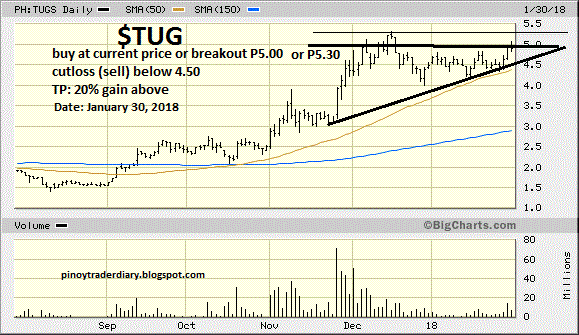
I made a simple sketch below on how I'm gonna trade $TUGS.


This plan only includes my entry and cut loss price. For more details on how I sized my position and manage my risk, please read here. 

Please take note that I put a 20% TP only for reference (not actual), as I usually like to trail my stop so my selling price is not fixed. Read here why I don't like using TP (Target prices).

Want to know how I did last year? Read it here. 

I will try to keep this post updated as often as I can.

Notes: IMO, Immediate index support is at PSEi 8800, and anything below PSEi 8500 will cause me to lighten up my positions significantly.


Cheers.

Update: February 2, 2018


After seeing some strenght with the stock yesterday, I added $TUGS to my portfolio with an average price of P5.02/share. The breakout from an ascending triangle set up coupled with some significant increase in volume triggered my BUY signal. The stock reached it's 52-week high of P5.70 today but closed at P5.37 (+2.48%) mainly due to profit taking. I am currently putting my stop at P5.00. Next week, we'll see if the breakout is confirmed and the stock will start a new trend or if it is just one of those false breakout case.

Re: Index (PSEi). I'm glad the index went back above 8800 again. My stop will still be at PSEi 8500.

Update: February 13, 2018


So $TUGS broke its P5.30 resistance and is now at around P5.80. I moved my stop at P5.30 breakout point. I'm a a little uneasy that $TUGS volume is not increasing at this breakout, so I'll be watching this stock in the next few days to see if it will show life. I'm currently at approx +15% gain but I am willing to let the stock do its thing for now. Let's see..

Update: February 19, 2018 


chart by www.bigcharts.marketwatch.com
$TUGS showed some good price action today, reaching its 52-week high of P6.09. The lack of bigger volume is concerning though as it looks like it has no interest from fresh buyer to push the price higher. A breakout of P6.00, with volume spike, is an oppurtunity to add more position or even as an entry point for new buyers. I'll put my stop just below P5.50 as it will mean that the stock broke down of its trading range and might not be ready for a breakout yet. Profit at approx 16%.

Update: February 23, 2018

After almost 3 weeks of holding $TUGS I sold it with a meager profit of approx 8% when it hit my stop at below P5.50. The index is not really doing well below 8500, so I am expecting most of the stocks to correct as well. I believe trades should end either with a big profit, a small profit or a small loss; that's why I am putting a lot of emphasis on my trailing stops. Avoiding big losses is the key to longevity in the market.

$TUGS will remain on my watch list for now.


Cheers.
Jan 2, 2018

Post 45: Lessons from my top 5 trades last year (2017)

They say that we can learn a lot of lessons reviewing our loses and mistakes, while it is accurate, I also believe that we can learn a lot from reviewing our winning trades.

Below are my top 5 winning trades last year. While I am happy with my profits, my numbers showed I only have approx 21% average profit last year. (See previous post) Quite low if you ask me.

Reviewing my trades helped me identify problems in my process. Because of it I can implement some improvements that will hopefully improve my results this year.

1. $ROCK

chart by www.bigcharts.marketwatch.com
I noticed an increased in volume and a slight uptrend mid-November that triggered my buy signal. Sold it when it broke the trendline Dec. 15, 2017. I timely avoided a turn of trend in this trade.


2. $MAC

chart by www.bigcharts.marketwatch.com

Bought it September when I saw a tightening price volatility with an increase in volume. Sold it Around November 22 with a 41% profit when it broke my trailing stop.

This stock perfectly stayed above 50 SMA, which is usually my last line of support in a trade. I could've hold it and be alright by now. It looks ready to take another breakout this year, I'll be closely watching.

Also, I could've seen this stock earlier if I am diligently doing my research. I could've bought it around June or July of 2017. This reminds me to do my research and screening diligently so that I wont miss many buying opportunities in the future.

3. $WLCON

chart by www.bigcharts.marketwatch.com
Bought this twice in May with an average of P5.42/share. Held on to it until I am convinced that it broke the 50sma on October 11, 2017.

Starting now, I will respect the 50sma as my last line of support. I guess I was hoping for the price to go up once more and give me the opportunity to sell at a higher price. Hope is not a strategy. Follow the plan.

4. MRP

chart by www.bigcharts.marketwatch.com

Here is another one that I bought a little late. January 2017 is where the ideal entry should be. I guess I'm not religiously doing my screening by that time again. (reoccurring mistake).

Another mistake I made is when I sold this at P8.68, a safe distance from any of my trail stops. I could not explain this one, I don't know why I sold this at this price. I could've squeezed a little bit more from this trade if only I have just defined my selling strategy.

It is very evident by now that I need to work on my selling strategy. Something I am planning to improve this year.

5. $IMI


By now I have to admit that I have a very faulty selling strategy. This one is a good run from my entry price of P6.91 to my selling price of P13.30 in August.

Why do I feel like I sold too late this time? I know I did.

The stock broke 50SMA and I sold it. I followed my plan but I still lost a big chunk of the profit and I felt bad about it.

Conclusion

It is very clear by now that I should be working on my selling strategy. I don't have the perfect system yet and this trades proved it. I am currently working on a selling strategy to at least improve my profit's average percentage.

I will also be allocating more time in screening potential winners for me to catch them in their earlier stages. Nothing beats a lower average price.

My batting average of 52% (13 out of 25 trades) is good enough, but I need to catch these winner earlier and learn how to sell them. A concrete plan with a win-win result is on the drawing board.

By reviewing my trades,  I know where my mistakes are. Knowing my mistakes will help me create a specific plan to address each of them.

My next post will be about my top 5 losers.