Showing posts with label Philippine stocks. Show all posts

Mar 20, 2020

PSEi: Golden Cross vs the Death cross

As a trend follower, I mainly rely on moving averages to identify trends in stocks. Reasonably, I'm also using the same tool in assessing the general market's trend. One traditional moving average signal that I'm using to identify longer time-frame trend of the PSEi is the 50 and 200 simple moving averages crossover.

A GOLDEN  CROSS (50 sma crossing above 200 sma) indicates a long-term bull market going forward, while a DEATH CROSS (50 sma crossing below 200 sma) signals a long-term bear market. Either cross may occur as a signal of a trend change, but they more frequently occur as a strong indication of a reversal that has already taken place. I use this moving averages to decide whether I should have some position or not, as well as determining the percentage I'm willing to risk in every trade. Mix in volume and you'll have a simple but very reliable signal to use. As always, for me price and volume is king, the rest are just noise. A simple tool to clearly see the market's direction (up, down, or sideways).


Notes: 
I'm only in the market right after the GOLDEN CROSS. 
I trade normally when prices above 50 sma. 
I lessen risk tolerance when prices go below 50 SMA.
I go all cash and wait in the sidelines when DEATH CROSS happens.

This strategy has saved my portfolio from big losses during big market dips. Additionally, on  long up trends I can confidently let my profits run as long as my moving averages are pointing up. Take note though that I only use this to assess the general market's trend.

Feb 2, 2019

Post #56: My January 2019 trades review

Starting this year I'll make it a habit to review all my trades every end of the month; doing this will help me see my mistakes, correct them and fine tune my system.

I will post some of my trades here.

ABACORE CAPITAL HOLDINGS, INC. ($ABA)

Bought: P0.63
Stop: P0.59
Sold: P.071
Return: Approx +13%


Comment:

I tend to be just swing trading for now as the index is still ranging around 8000. Sold this one on the first sign of strength.


ABOITIZ EQUITY VENTURES, INC. ($AEV)

Bought: P58.95
Stop: P55
Sold: Half @ P65
Return: Approx +10%
Status: Holding half with stop at P62.50


Comment:

I sold half of this stock after it showed a very long red candle in one day, that move actually hit my stop but I wasn't able to sell it immediately because of my FT work. I decided to wait a few days to see the reaction after that sudden sell off. Also, I decided to sell only half of the position as I see the stock moving in sync with its 20 day moving average. I'll give it a few more days to see.


GREENERGY HOLDINGS, INC. ($GREEN)

Bought: P2.00, P2.21 (Average P2.10)
Stop: 20 MA
Sold: (half) P3.20
Status: Holding half


Comment:

I wasn't expecting this stock to gap up and reach its ceiling price in just a day, I just knew that the narrowing price range is a good sign. I'm surprised to read the news early morning of Jan. 31 that the company is having an MOA with TheBizLink; the market presumable took it as a very good news, reason enough for it to gap up in the open and reached ceiling price at one moment. Looking at the intraday chart, I decided to sell half of it when the price broke P3.20. Though, I will keep the other half to see the strength of the rebound.


VITARICH CORPORATION ($VITA)

Bought: P2.03
Stop loss upon entry: P1.90
Sold: P1.98
Return: (-2%)


Comment:

The price reached P2.20 (1/15/2019), which could've given me an approximately +9% of return, but I was thinking it was too early to sell and only moved my stop to P2.00. It seemed to be a strong support until it convincingly broke last 1/28/2019, reason enough for me to sell all of my positions with a -2% loss.


TRAVELLERS INTL. HOTEL GROUP, INC. ($RWM)
Bought: P5.38
Sold half: P5.75 (6%)
Sold half: P5.52 (2.5%)


Comment:

This stock seem to be a sleeper stock for a long time, until one day it suddenly just rises from the ashes without any warning. The next day though, it went below my trailing stop and I wasn't able to sell (OFW) so I decided to wait a few days to see the price action before selling. This stock confuses me somehow, so I decided to let go of it for now. I also sold my $RWM in my sister's account, which I bought last year.

PHILEX MINING CORPORATION ($PX)

Bought: P4.26
Stop: P4.00
Sold: P3.91
Return: (-8.30%)


Comment:

I bought this stock when it's about to breakout the P4.30 level and I put my stop at P4.00. Sold it ASAP when it broke P4.00.

Note: The price of $PX has recovered well after that and I already bought some positions again.


OTHER STOCKS

Some other stocks I traded but not shown here are $CHP, $NRCP, $BLOOM.


Jan 21, 2019

Post #55: PSEi Golden Cross


The golden cross is a bullish breakout pattern formed from a crossover involving index short-term MA (50) breaking above its long-term MA(200). Golden Cross indicates a bull market on the horizon and is reinforced by high trading volumes.

Is the Golden Cross the sign we have been waiting for? Will the index resume its uptrend and break the 8000 resistance convincingly?


No one knows for sure, so it pays to be always ready no matter what the next few weeks will bring; I have my trading plans in place, whichever direction the market will take. I'm so ready I can't wait!


Good luck to us all my fellow traders.

Jan 8, 2019

Post #54: Short Play $CHP

chart by marketwatch.com
Latest: January 14, 2019
Price: Php 1.98
Conclusion: Cut loss hit (SOLD)

Latest: January 13, 2019 (10:40 PM)
Price: Php 2.03
Stop: Php 2.00

Update: January 8, 2019 (11:00PM)
Price: Php 2.14 (+7%)
Stop: Php 2.00

Disclaimer: This is only a stock simulation trade. Follow at your own risk. Proper risk management measures should be observed in every trade.

Post #53: Trading simulation ($AEV)

chart by www.marketwatch.com
Update: January 21, 2019
Price: P66.60
Stop: P64
Approx +15%


Latest: January 15, 2019
Price: Php 64.80
Stop: Php 60

Latest: January 13, 2019
Price: Php 60.00
Stop: Php 58.00

Update: January 8, 2019, 10:00 PM
Price: Php 57.20 (no change)
Stop: Php 55


Disclaimer: This is only a stock simulation trade. Follow at your own risk. Proper risk management measures should be observed in every trade.

Jan 3, 2019

Post #52: My 2018 results

I had a very disappointing 2018, my entire portfolio suffered a -19% loss. My stock picking only had 33% success rate, picking only 9 winners out of the 27 trades I took last year. Though I managed to keep my risk percentage within my limit, my poor stock picking numbers really hurt my portfolio's entire performance. 


I forced some of my trades in a downhill market; and the market taught me a hard lesson. My strategy will not work on a down-trending market, I actually knew that, but still I tried to enter positions I thought are feasible. I knew I should listen to the market, but I still took some risk and I paid for it with my money. A different kind of market needs a different kind of approach, that's my main takeaway from this lesson. I cannot be a momentum trader in a market for swing traders. 

This year, 2019, the PSE index started the year ranging between 7400 and 7600; a breakout of the range might show the direction of the market. I like the fact that we seem to be independent of what's going on with the world markets right now. Our market seems to be shaping it's own direction. It is exciting to see where this is heading.

Losing gives us opportunities to learn and evaluate our selves. I will consider my 2018 draw-down as just another lesson learned. Trading for me is a long game, and a year of negative return will not deter me but will instead fire me up to learn more. We all still have our best years ahead of us. Keep grinding , keep learning. 


Nov 27, 2018

Post #51: PSEi update

PSEI 5 year weekly chart by www.Bigcharts.Marketwatch.com

The Philippine stock exchange index (PSEi) seems to be displaying a corrective wave in its downtrend. I will still remain cautious and will not enter in any position. Although some bounce plays are possible in this scenario, it is something that I don't intend to take anymore. I am in the opinion that the downtrend is still intact and the possibility of downward continuation is highly possible.

I'm still sticking to my plan of not trading a generally bearish market. I am willing to wait for the market to tell me when it's time to go back again. There is no rush to make money in my part; I consider trading as a long game and I'm planning to stick around as long as I can. I believe the key to longevity and winning in this game is risk management.

I will be just watching the market until my signal tells me it's time to take some position. I might even end the year without entering any position. I'm sticking to my guns.


Oct 3, 2018

Post #50: PSEi worst days far from over

The Philippine index seem to be bouncing inside the range of 7000-8000 right after it went below 8000 last April 2018. In my opinion, any breach on either side will dictate the direction of the entire market for the next months to come. 

PSEi as of October 3, 2018
I am still not trading this market. Although Iv'e seen some very tempting set ups and possible short plays on some individual stocks, I am not breaking my trading rules. I will be at the sidelines as long as I don't see any reason to go back in. It might take a few more months,  or even years for the market to recover, and I'm willing to wait. There are other things to do in life outside of trading. Trading is a long game.There are also other ways to build wealth. Diversify.

This year's market condition give me another perspective on the idea of trading as a full-time job. Sure it would be fun in a trending up market, but markets like the one we have right now will be a sure snoozefest. The change in perspective surely has affected my long term plans as well. It's funny how we feel so sure of what we want until something change our views entirely. It reminds me to be always flexible with my plans and goals, because nothing stays the same and you should always be re-evaluating your next move. 

Jul 18, 2018

Post #49: My trading system flowchart

Lately, I am making an effort to make my trading as systematic as possible.  My goal is to set definite trading rules that will eliminate any second-guessing and emotions in my executions. Below is an overview of what I am currently doing.  I decided to show it in a flowchart form.


The very first step is to asses the general market's trend. This is where I will decide whether the market situation is favorable or not. It is also where I decide if how much of my capital will be put into position and how much will stay liquid. For example, in a down-trending market I might want to be only 25% in position and stay 75% in liquid cash.

Stock selection is where I decide what criteria will be factored in before a stock enter my watch-list. I am using both technical and fundamental factors. For example, I like stocks that are showing tight volatility ranges with increasing volumes. Fundamental factors includes P/E ratios, float % and many others.

Specific entry criteria is where I intend to enter a position. One example is a good upside breakout of a tight ranging stock with above average volume. I am looking for various set ups and I'm using a specific entry point strategy to avoid confusion in my execution.

Risk management is where I set up entry stops, position sizing, trailing stops and my risk tolerance. This is where I also scale my position up to avoid getting hurt in whipsaws. I believe this is one of the most important process that traders should focus.

Selling is where I set specific rules on when to sell my positions. Example of this is when the price hit my trailing stop or when the price is showing some topping signs.

Last, but also the most important part of my system, is the feedback and trading review part.This is where I review my trades to see if there's any part of the system that needs to be revised for improvement. No system is perfect, that's why constant feedback is important.

That's how simple my system will be. Although revision is expected, I will try to always keep it as simple as i intended it to be. There is no need for an over-complicated system, but at the same time you also need specific rules and system if you want to be successful in this endeavor. Otherwise, your trading will be driven by your emotions and it will become just some random buy and sell transactions without any clear justification.

Jun 13, 2018

Post #47: End of May 2018 numbers

This is a bitter pill to swallow, but I have to accept that this kind of market is not really my forte. I'm down -10% YTD and in my opinion is experiencing a really bad drawdown. I'm focusing all my efforts now on risk management and keeping may capital safe.


With PSEi ranging between 7600 - 7800, I'm still very wary of putting a big chunk of my portfolio in positions. My risk management involves smaller sizing, smaller risk tolerance and tighter stops. I am hoping to see a clearer market trend when the index gets out of this 7600-7800 range, hopefully with an upward bias. Otherwise, for me it is either play tight defense or get out of the marekt entirely.

Jan 2, 2018

Post 45: Lessons from my top 5 trades last year (2017)

They say that we can learn a lot of lessons reviewing our loses and mistakes, while it is accurate, I also believe that we can learn a lot from reviewing our winning trades.

Below are my top 5 winning trades last year. While I am happy with my profits, my numbers showed I only have approx 21% average profit last year. (See previous post) Quite low if you ask me.

Reviewing my trades helped me identify problems in my process. Because of it I can implement some improvements that will hopefully improve my results this year.

1. $ROCK

chart by www.bigcharts.marketwatch.com
I noticed an increased in volume and a slight uptrend mid-November that triggered my buy signal. Sold it when it broke the trendline Dec. 15, 2017. I timely avoided a turn of trend in this trade.


2. $MAC

chart by www.bigcharts.marketwatch.com

Bought it September when I saw a tightening price volatility with an increase in volume. Sold it Around November 22 with a 41% profit when it broke my trailing stop.

This stock perfectly stayed above 50 SMA, which is usually my last line of support in a trade. I could've hold it and be alright by now. It looks ready to take another breakout this year, I'll be closely watching.

Also, I could've seen this stock earlier if I am diligently doing my research. I could've bought it around June or July of 2017. This reminds me to do my research and screening diligently so that I wont miss many buying opportunities in the future.

3. $WLCON

chart by www.bigcharts.marketwatch.com
Bought this twice in May with an average of P5.42/share. Held on to it until I am convinced that it broke the 50sma on October 11, 2017.

Starting now, I will respect the 50sma as my last line of support. I guess I was hoping for the price to go up once more and give me the opportunity to sell at a higher price. Hope is not a strategy. Follow the plan.

4. MRP

chart by www.bigcharts.marketwatch.com

Here is another one that I bought a little late. January 2017 is where the ideal entry should be. I guess I'm not religiously doing my screening by that time again. (reoccurring mistake).

Another mistake I made is when I sold this at P8.68, a safe distance from any of my trail stops. I could not explain this one, I don't know why I sold this at this price. I could've squeezed a little bit more from this trade if only I have just defined my selling strategy.

It is very evident by now that I need to work on my selling strategy. Something I am planning to improve this year.

5. $IMI


By now I have to admit that I have a very faulty selling strategy. This one is a good run from my entry price of P6.91 to my selling price of P13.30 in August.

Why do I feel like I sold too late this time? I know I did.

The stock broke 50SMA and I sold it. I followed my plan but I still lost a big chunk of the profit and I felt bad about it.

Conclusion

It is very clear by now that I should be working on my selling strategy. I don't have the perfect system yet and this trades proved it. I am currently working on a selling strategy to at least improve my profit's average percentage.

I will also be allocating more time in screening potential winners for me to catch them in their earlier stages. Nothing beats a lower average price.

My batting average of 52% (13 out of 25 trades) is good enough, but I need to catch these winner earlier and learn how to sell them. A concrete plan with a win-win result is on the drawing board.

By reviewing my trades,  I know where my mistakes are. Knowing my mistakes will help me create a specific plan to address each of them.

My next post will be about my top 5 losers.

Dec 1, 2017

Post #43: YTD update

I had a very disappointing month, my YTD is experiencing another draw down.

I'm back at 74% YTD with only a month to go before the year ends.

Is my 100+% goal return possible before year-end? I guess we only have to wait and see.


I am currently 75% cash as the index went below 8200.

Sold my $EW , $PXP and $MEG, stops hit.

Only holding $ROCK with a 7% gain.

Things like these happens, I need to be more sharp and focus. I made a lot of mistakes and I'm taking notes of them to avoid the same mistakes again in the future.

Good luck to us all. May all our goals be reached before this year ends.


Nov 15, 2017

Post #41: $PRMX out, bought $EW

Quick updates:

Hit my trailing stop in $PRMX when it went below P7.00 today. I took out a small profit. This will stay in my watchlist for now.

chart by www.bigcharts.marketwatch.com

Moved my funds to $EW as it broke P34 resistance. Expecting it to fill the gap just below P34 but not lower than it, or stop loss will be initiated.

chart by www.bigcharts.marketwatch.com


Current stocks in Portfilio: $EW,$STI,$MAC,$MEG

$STI stop @ P1.60 breakdown
$MAC @ +58%, stop at P22 breakdown
$MEG  @ +15% , stop at around P5.30 breakdown

Good luck to us all!

Alex


Nov 8, 2017

Post #40: Sold $PGOLD, bought $TUGS

Update: November 10, 2017 - Sold $TUGS, its volatility doesn't fit my trading style. 

After two months of holding $PGOLD, I decided it is too slow of a stock and sold it for only around 5% gain. I just realized that maybe I waited too long for it to do something. That's my problem, I'm too patient in trading.

After that, half of the funds from the  $PGOLD sale, I decided to move into $TUGS. It seem to be starting a good trend. As always, this being a speculative play, I'll make sure to watch my stop loss level closely.

chart from www.bigcharts.marketwatch.com

I'm also watching $CPM especially if it breaks above P1.70 convincingly.

chart from www.bigcharts.marketwatch.com


I realized that if I want to make it past 100% YTD returns before the year ends, I need to let go of the slow stocks in my portfolio and find a high flyer. Let's keep this simple, cut the losers and the laggers short and let the winners run until they ran out of steam.

Cheers.

Alex

Oct 31, 2017

Post #39: Risk tolerance and position sizing

A lot of people have been asking me about position sizing and how do I manage my risk, so I think it is about time for me to explain it here.

To put it simply, it all starts with my risk tolerance. 

What is risk tolerance? For me, it is the percentage of my capital that I am willing to risk in every trade. 

I'm gonna give you an example to make it clear.

Let's say for example that  you have P100,000 starting capital. How much of it are you willing to lose in every trade you make? Is it P2000, P5000, or more? The amount is entirely up to you.

Let's say you are willing to lose only P2000 per trade. So your risk tolerance is 2% of your trading capital.

Capital = P100,000
Risk tolerance = 2%
Risk/trade = P2000

Let's do a trade example to make it more clear:

Supposed that you want to buy $STI at P1.80.
You also want to put your stop at P1.60.

chart from www.bigcharts.marketwatch.com


All you have to do is calculate how many shares you have to buy for you to be stopped at your 2% risk tolerance in case your trade goes wrong.

Let's do the math.

Total capital x Risk tolerance % =  Risk per trade
(P100,000 x 2%)  = P2000

Buy price - Stop loss price = Risk per share
(1.80 - 1.60 = .20 cents)

Risk per trade divide by(/) Risk per share = Position size
(P2000/.20 cents = 10,000)

It means you can buy 10,000 shares of $STI at P1.80 price with a stop loss at P1.60.

10,000 shares of $STI at P1.80 will be worth P18,000.

If it breaks its support at P1.60 and you sell it, it will total in cost at approximately P16,000.

(P18,000-P16,000 = P2,000)

You lost P2000, which is still within your 2% risk tolerance.

It is that simple.

Notes:

This is just an example, you can choose your own % in risk tolerance. You can even include broker commission charges if you want to be precise in your calculation.

It is advisable not to go beyond 2% risk tolerance to preserve your capital. This way, you can minimize losses even if you are always stopped out in your trades. As long as you keep winners run and stick to your cut loss discipline, you will end up on the profit side most of the time.  Besides, if you're always stopped out it means you need to work on your entry strategy.

You can add more position if the price of the stock goes up.

Always trail your stop. How to determine it is entirely up to you. You can use support and resistance, moving averages, Fibo retracement or whatever it is that works for you.

Hit me up for question.


Alex


Post #38: Portfolio's YTD update

As of October 30, 2017, my Portfolio's YTD return is at 81.60%. The few months of drawdown slowed down my progress, but I'm still confident I can make it past 100% by year-end.


I'll just continue to watch my stops and look for other opportunities. As long as I keep my losses small and ride my winners, my portfolio will be alright. I'm also looking for ways I can further improve my system.

Portfolio update:

screengrab from Philstocks App

Hope everyone enjoys their All Soul's day holiday. This is a good reason to take your mind away from the market and spend quality time with your family. Always remember, time is the most precious and priceless investment one can have; spend it wisely.

The last two months of the year should be good for stocks. Bring it on!

Cheers

Alex


Oct 13, 2017

Post #37: Watching $STI


Since I have some extra funds from the profits I took from $WLCON, I am currently looking for a new stock to buy.

There are really some interesting stocks like $IMI and $SMPH for example that are very tempting at their current set ups. 

Another stock that I find interesting is $STI. It looks like it is posing for a breakout. And I like the fact that it doesn't get a lot of attention yet. 


I'm thinking of buying it at it's current price of P1.60 and put my stop at below P1.50. We'll see what happens.

Current portfolio stocks:

$PRMX +19%
$MAC +11%
$MEG +13%
$PGOLD +8%

Oct 11, 2017

Post #36: Sold $WLCON

Quick update:

I sold my $WLCON when it broke my trailing stop at +50% gain.

chart by www.bigcharts.marketwatch.com

Now that I have funds for another stock, I'll be on the look up for my next monster stock.

Portfolio:

$PRMX
$PGOLD
$MEG
$MAC

Oct 6, 2017

Post #35: My YTD portfolio update

September 30, 2017 marked the end of the 3rd quarter and it's the start of the most exciting months of the year.

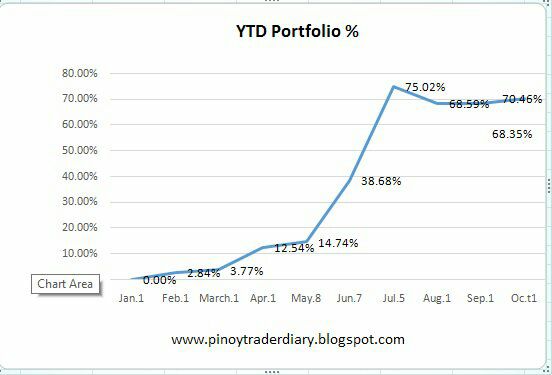
I'm glad to be slightly making progress after that small draw-down that started since July. I'm currently back at 70.46%.

By playing defense I was able to minimize the effect of those few bad months on my portfolio. 


My goal is to reach more than 100% return before the year ends. With the right mindset and focus, I am certain this is possible. With the index currently breaking new highs, all we need to do is find the right stocks to ride. Cut those loser stocks short and ride those winners up until they ran out of steam. Rinse and repeat. 

Good luck to us all.

Alex